无数据显示自定义图片
echartsIns.setOption({ graphic: { elements: [ { type: 'image', style: { image: '/resources/images/report/empty-bar.png', width: 200, height: 200, }, left: 'center', top: 'middle', }, ], },});多折线 y 轴数据不对应
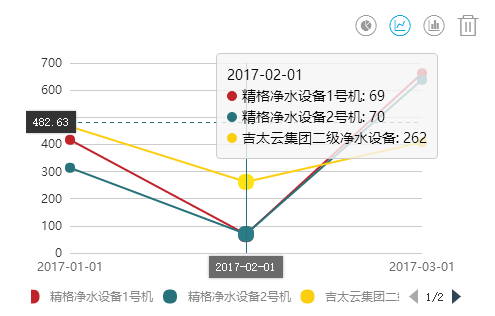
在官方的示例中 y 轴数据不对应,解决方法是把 series 里所有的“stack: '总量',” 都去掉 就可以了
提示框居中

tooltip: { trigger: 'axis', axisPointer: { type: 'cross' }, backgroundColor: 'rgba(245, 245, 245, 0.8)', borderWidth: 1, borderColor: '#ccc', padding: 10, textStyle: { color: '#000' }, position: function (pos, params, el, elRect, size) { var obj = {top: 10}; obj[['left', 'right'][+(pos[0] < size.viewSize[0] / 2)]] = 30; return obj; },}


